n 背景 n メトリクスだけでは、インシデントの全容の半分しか分からない n メトリクスとログの参照時の切替コストを最⼩限に抑える n アプローチ n Prometheusを参考にラベルを活⽤した時系列にデータを格納 n Cortexを参考にスケーラビリティを確保 n Non-Goal n “top 10 users with highest 99th percentile latency”みたいな統計情報の取得
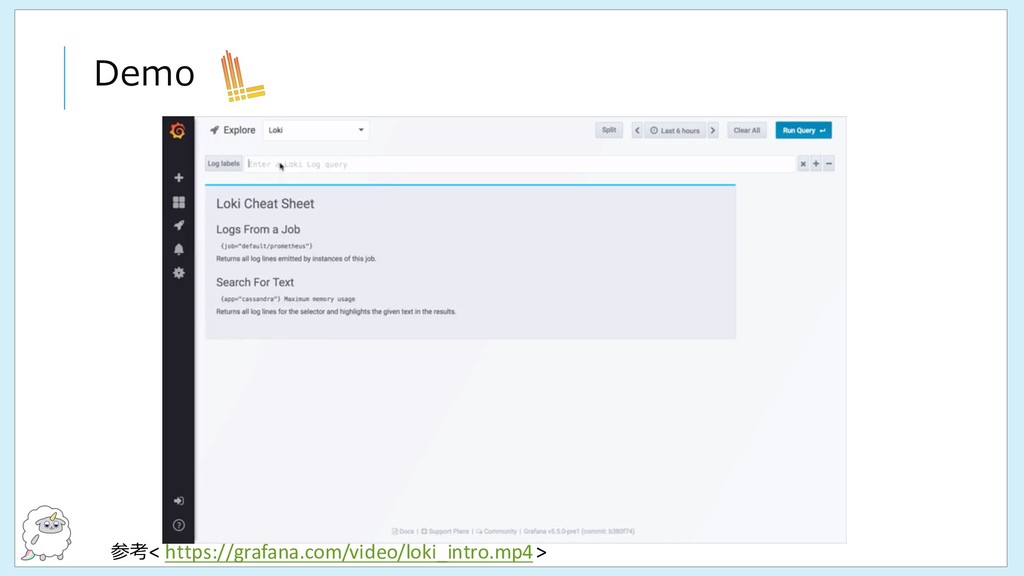
be used in production environments. 参考< https://grafana.com/blog/2018/12/12/loki-prometheus-inspired-open-source-logging-for-cloud-natives/ > n 2019年2⽉にGrafana v6.0が出て正式サポート予定
Adopting Prometheus the Hard Way n URL(https://sched.co/GrXX) n Large Scale Automated Storage with Kubernetes n URL(https://sched.co/Gsxn) n Intro: Prometheus nURL(https://sched.co/GrXX)